
Profit & Loss
View revenue, expenses, and net profit for a selected period.
The Profit & Loss Statement (also called the Income Statement) shows how much money your pharmacy earned and spent during a specific period. It starts with total income, subtracts all expenses, and arrives at your net profit or loss. Unlike the Balance Sheet which is a snapshot, the P&L covers a period of time: a month, a quarter, or a full year.
Navigate here from the sidebar: Accounting → Profit & Loss.
The screenshot below is from a mature store with active sales and purchases. A newly initialized store will show mostly zero values until transactions are recorded.
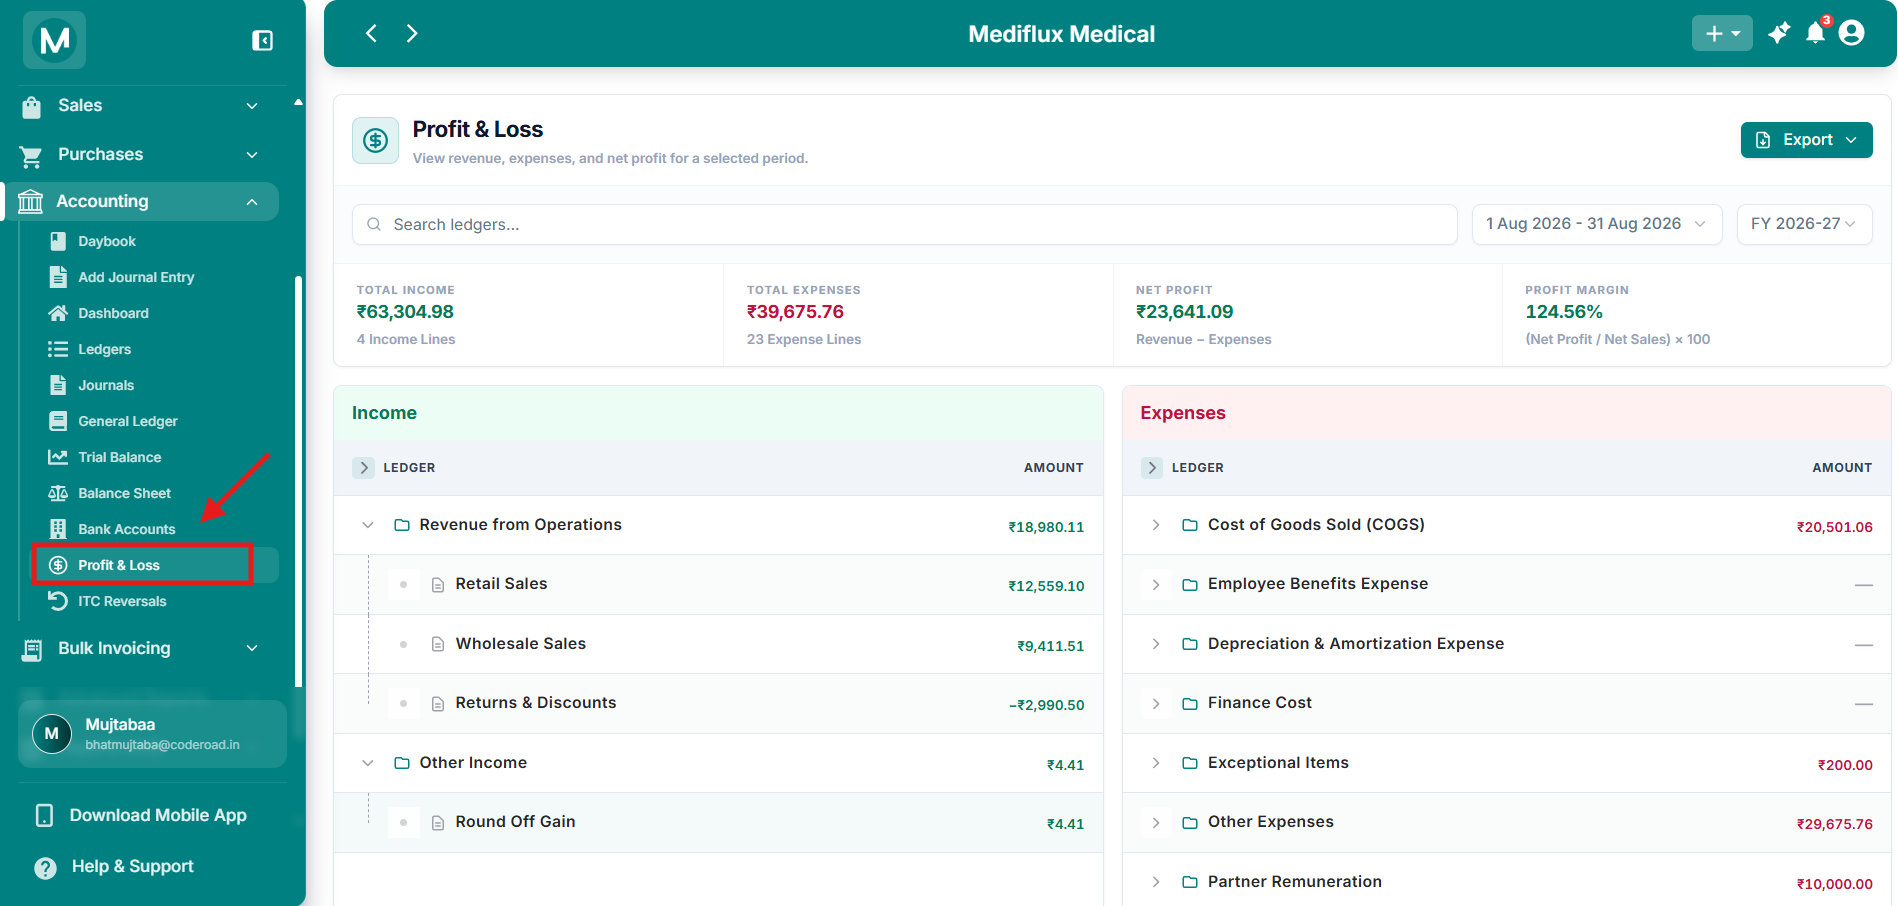
Profit & Loss Statement
Income and Expenses panels with summary cards.
Filter and export
At the top of the page you control the period and can export the report.
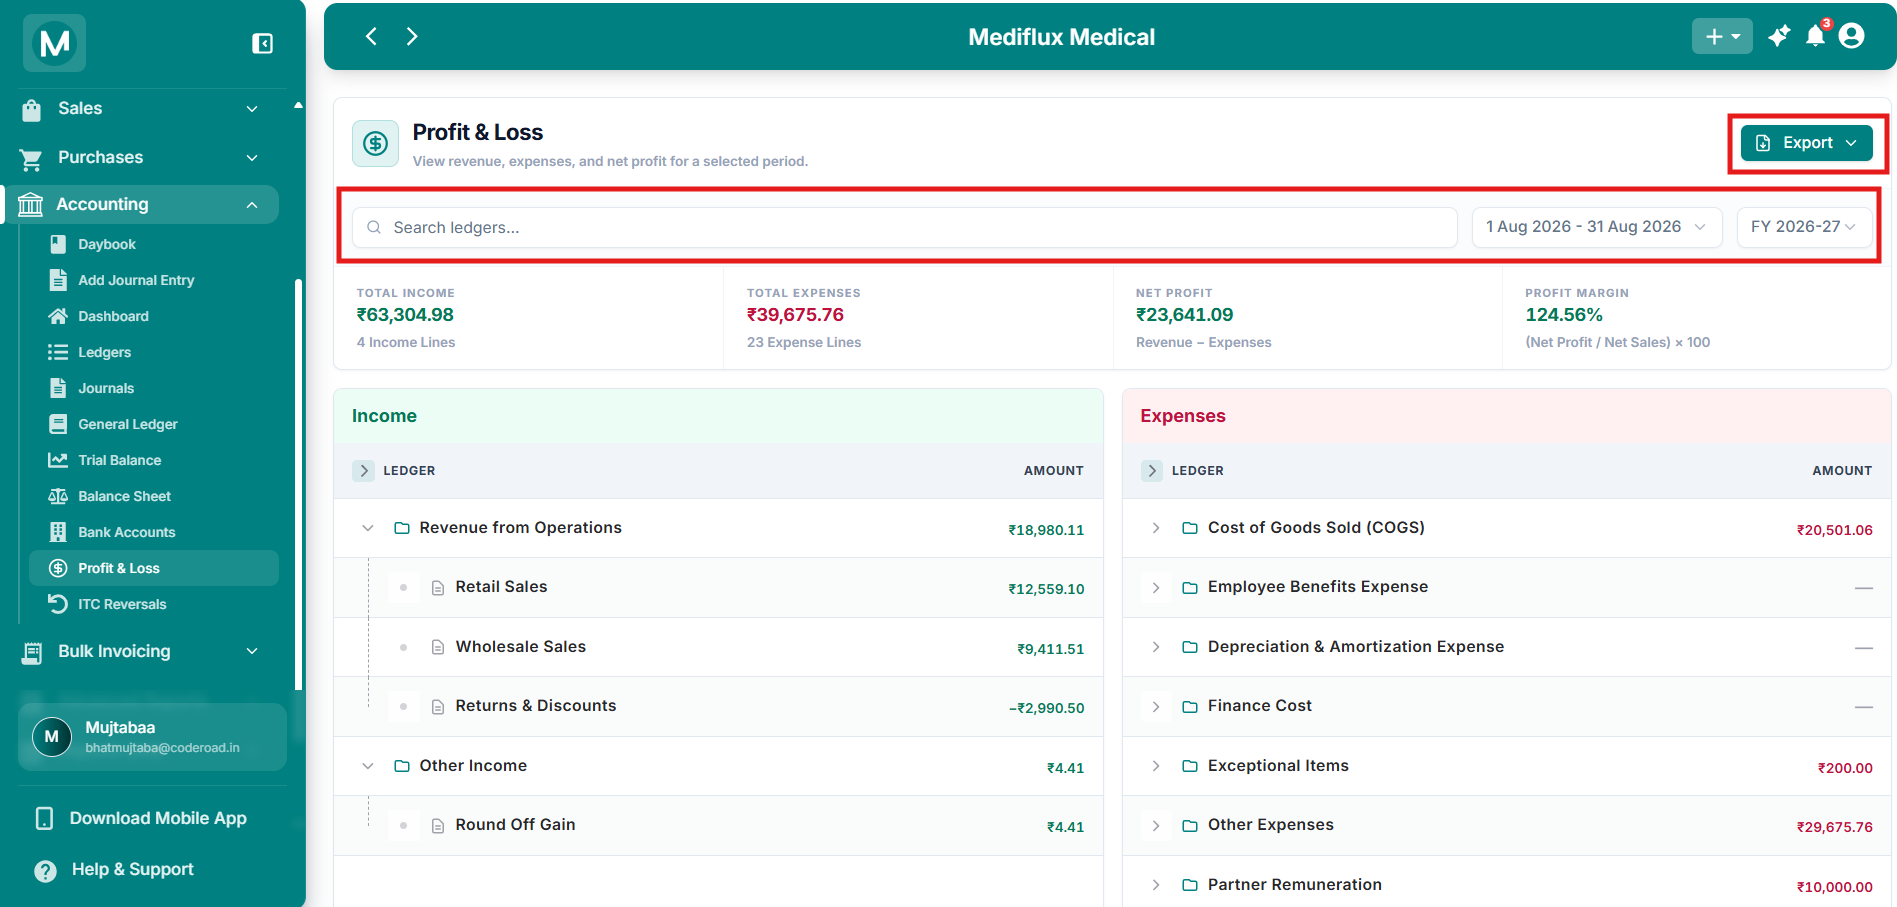
Filter and export options
Search and filter with custom dates or export in pdf or excel formats.
Top summary cards
Four cards at the top give you the headline numbers.
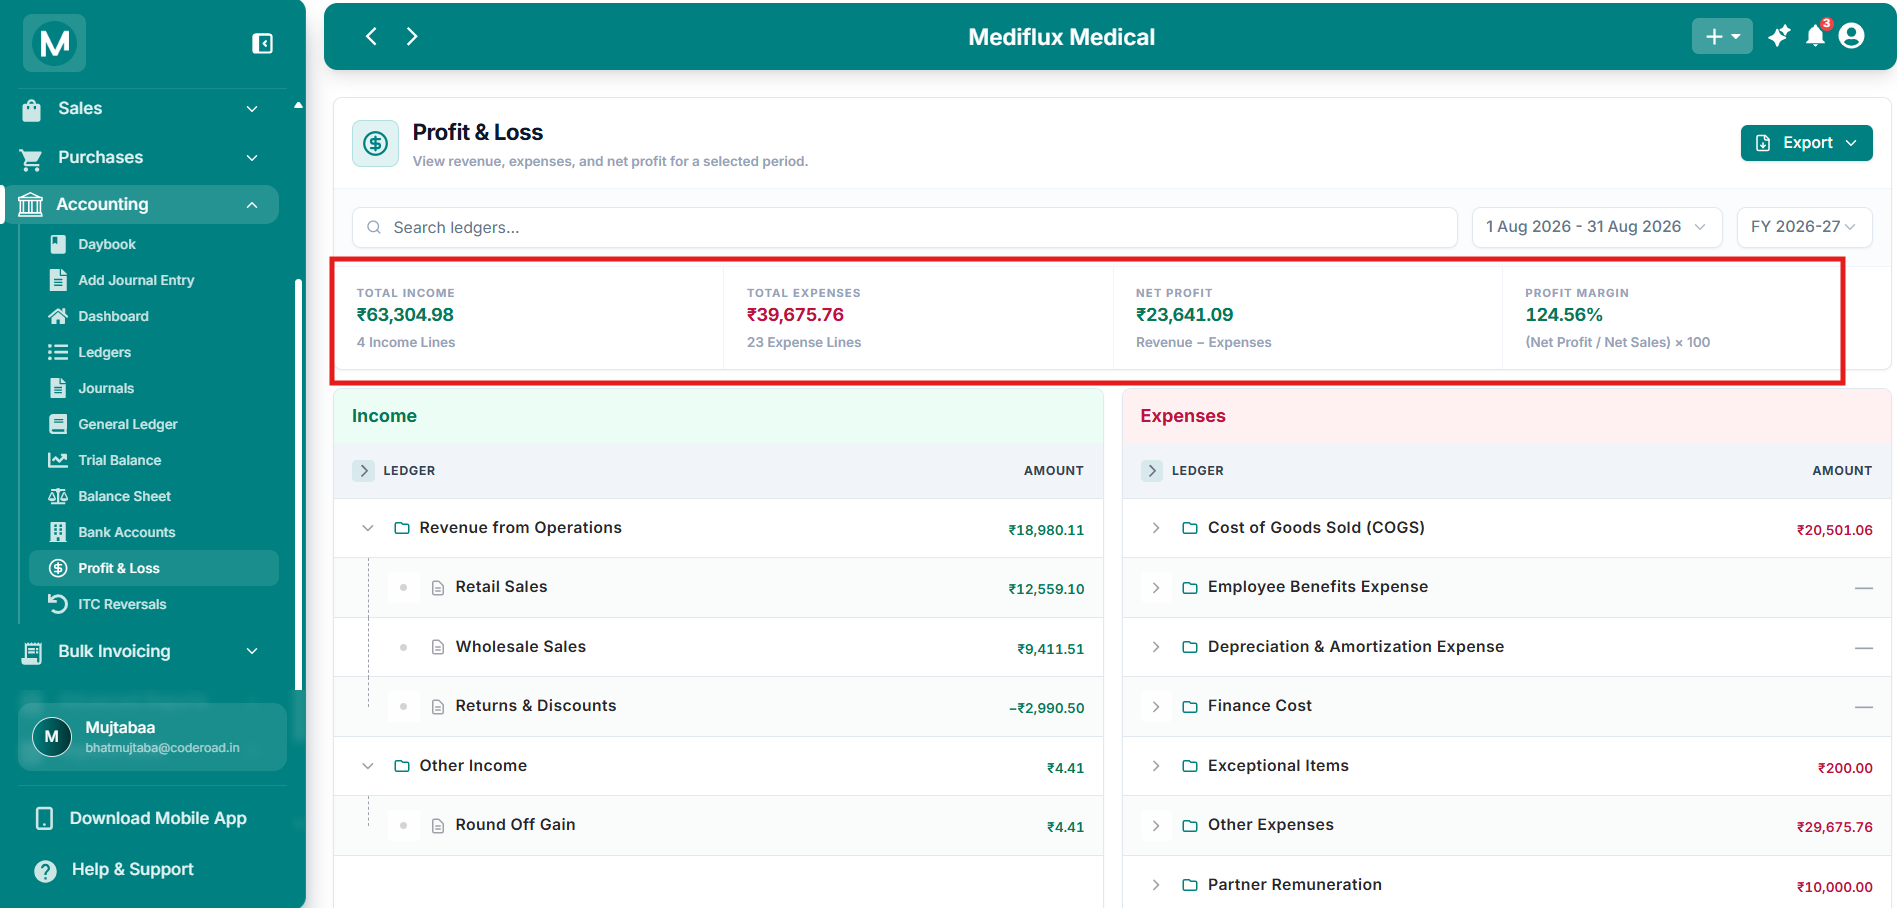
Top summary cards
Total Income, Total Expenses, Net Profit, and Profit Margin.
Income panel
The left panel lists every account that contributes to your income, grouped into categories.
Revenue from Operations
This is your core business income from selling medicines and services.
Returns & Discounts is a contra-revenue account with a negative amount. It reduces your total revenue because it represents sales that were returned or discounted.
Other Income
Non-sales income such as bank interest, round-off gains, or supplier adjustments.
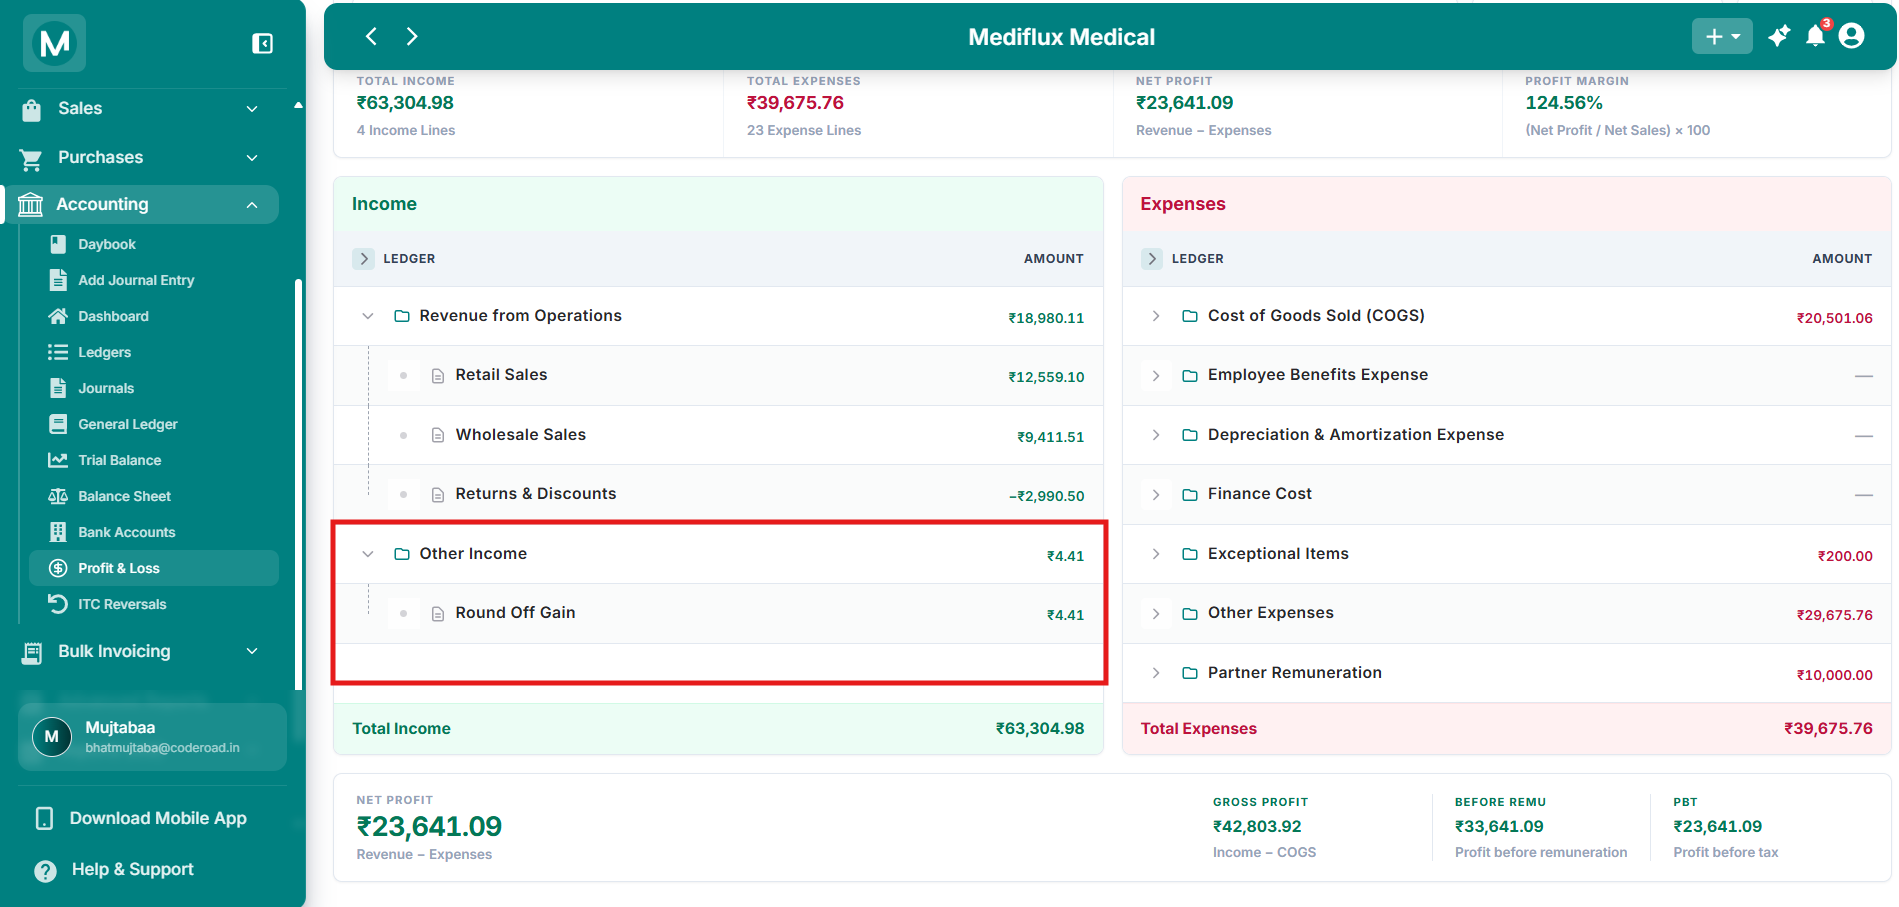
Income panel
Revenue from retail and wholesale sales, minus returns and discounts.
Total Income is the sum of all income categories. In the example above, the total is ₹63,304.98.
Expenses panel
The right panel lists every cost of running the pharmacy, organized by category.
Cost of Goods Sold (COGS)
Direct costs tied to the products you sold.
Closing Stock and Change in Inventory work together. Closing Stock is the value of inventory at period end. Change in Inventory is the adjustment that converts your purchases into the actual cost of goods sold. A negative change in inventory means your stock level increased during the period, which reduces your COGS.
Operating Expenses
Day-to-day costs of running the pharmacy.
Accounts showing – have no activity in the selected period. They will show amounts once transactions are posted to those ledgers.
Partner Remuneration
Payments to business partners for their services.
Exceptional Items
One-off or unusual expenses that are not part of normal operations.
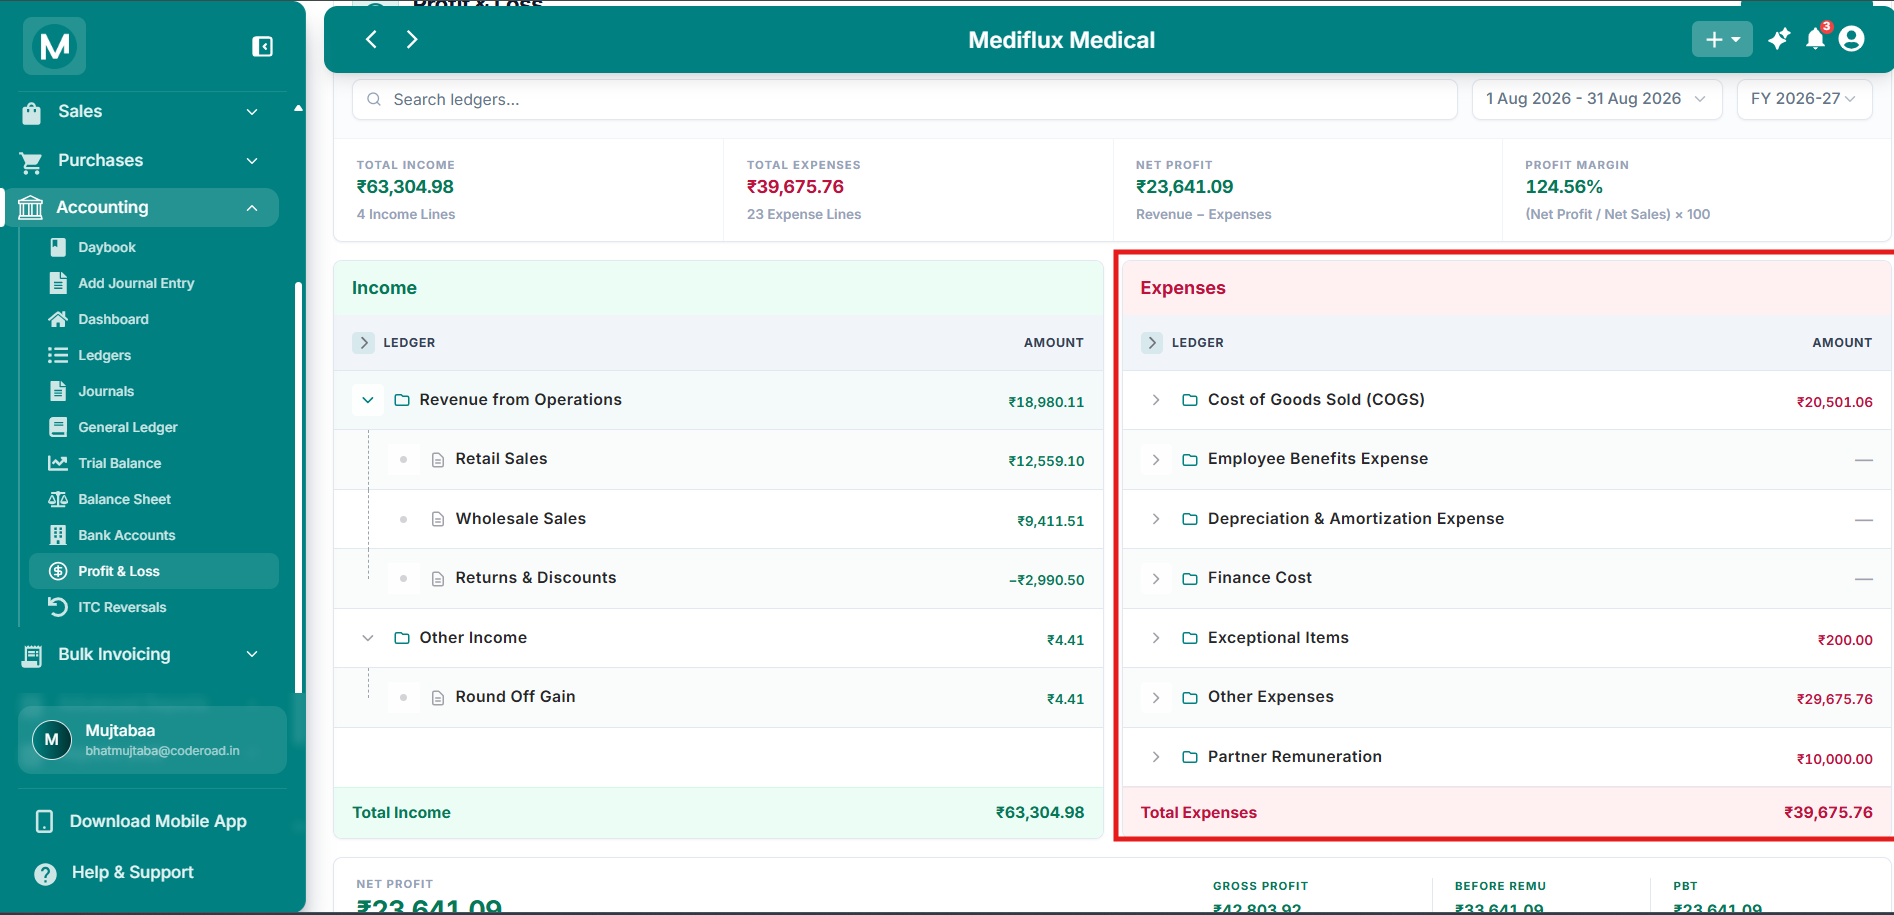
Expenses panel
Cost of goods sold, operating costs, partner remuneration, and exceptional items.
Total Expenses is the sum of all expense categories. In the example above, the total is ₹39,675.76.
Bottom summary cards
Below the two panels, four cards give you deeper insight into profitability.
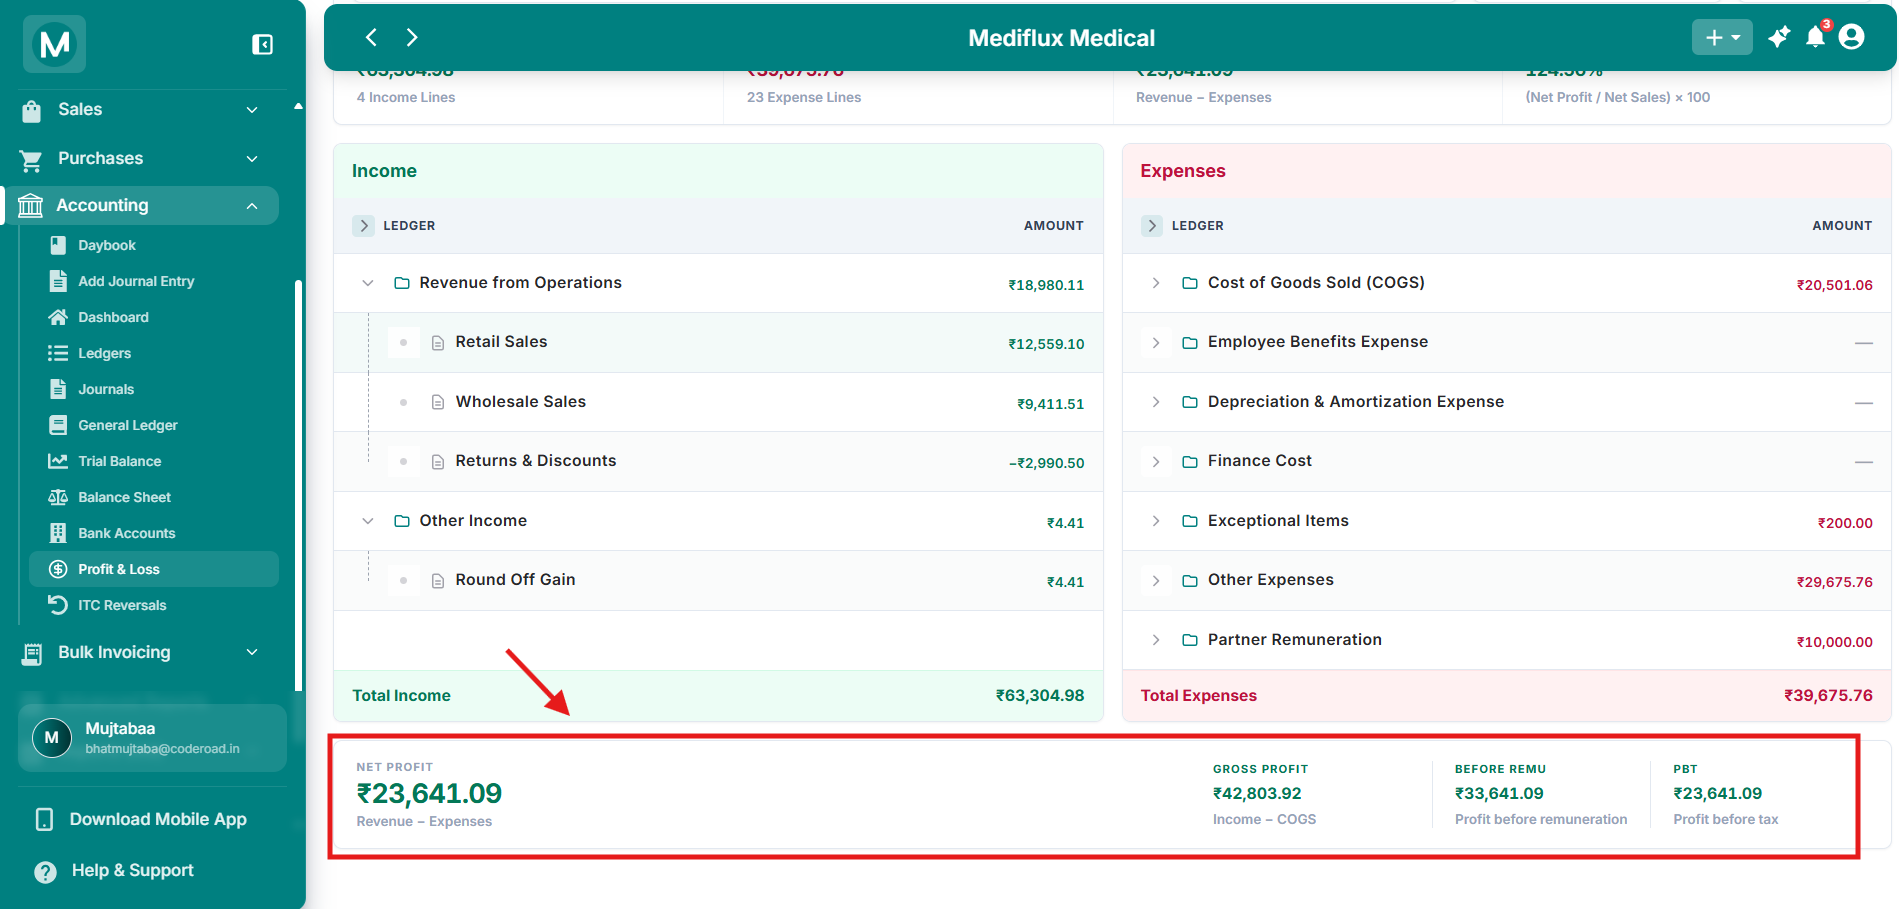
Bottom summary cards
Net Profit, Gross Profit, Before Remu, and PBT.
In the example above:
Before Remu is higher than Net Profit because partner remuneration (₹10,000.00) was deducted after the Before Remu stage. In this example, PBT equals Net Profit because no income tax has been recorded yet.
How to read the Profit & Loss Statement
The P&L flows from top to bottom like a waterfall:
- Start with Income – everything the business earned
- Subtract COGS – the direct cost of what was sold
- Arrive at Gross Profit – your margin on products
- Subtract Operating Expenses – rent, salaries, utilities, marketing
- Subtract Partner Remuneration – payments to partners
- Arrive at PBT – profit before tax
- Subtract Tax – income tax on profits
- Arrive at Net Profit – the final bottom line
If Net Profit is positive, the business made money. If negative, it operated at a loss.
Common mistakes
Ignoring Returns & Discounts
Returns & Discounts is a contra-revenue account. It reduces your total revenue but is easy to overlook. Always check this line. Net Sales = Gross Sales − Returns − Discounts. Ignoring it will make your income and profit margin look higher than they really are.
Treating Closing Stock as an expense
Closing Stock is an asset, not a cost. It reduces your COGS. Higher closing stock means lower COGS and higher gross profit. Treating it as an expense will understate your profitability.