
Accounting Dashboard
Get a quick overview of your pharmacy's total revenue, expenses, net profit, cash flow, trends, and financial alerts.
The Accounting Dashboard gives you a live snapshot of your pharmacy's financial health. At a glance you can see total revenue, expenses, net profit, and cash flow, plus trend charts and any active financial alerts.
Navigate here from the sidebar: Accounting → Dashboard.
A newly initialized store will show ₹0.00 across all cards and empty charts until you start recording sales, purchases, and other transactions.
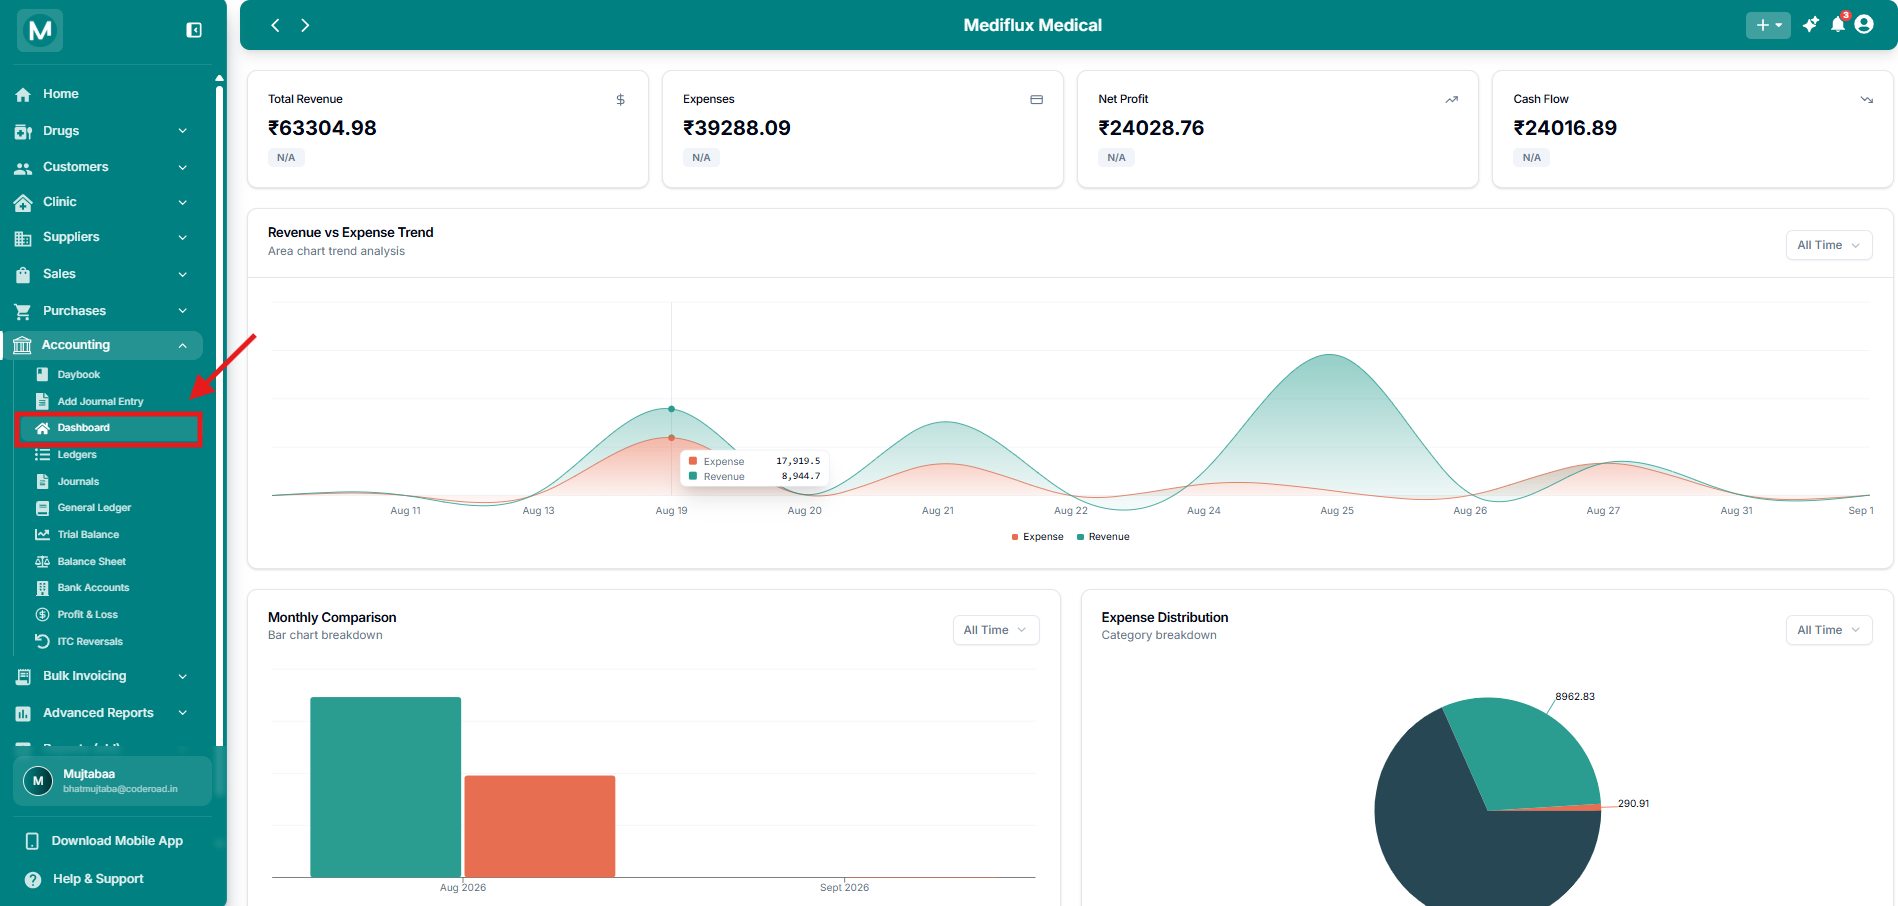
Accounting Dashboard
Summary cards, revenue vs expense trend, monthly comparison, expense distribution, and financial alerts.
Summary cards
Four cards at the top show the key numbers for the selected period.
Each card also shows a small trend indicator (or N/A when there is not enough data yet).
Revenue vs Expense Trend
This area chart shows how revenue and expenses have moved over time.
- Green area = Revenue
- Orange / red area = Expenses
Use the time filter in the top-right of the chart (All Time or other available ranges) to change the period.
The chart helps you spot periods where expenses rose faster than revenue or where revenue spiked.
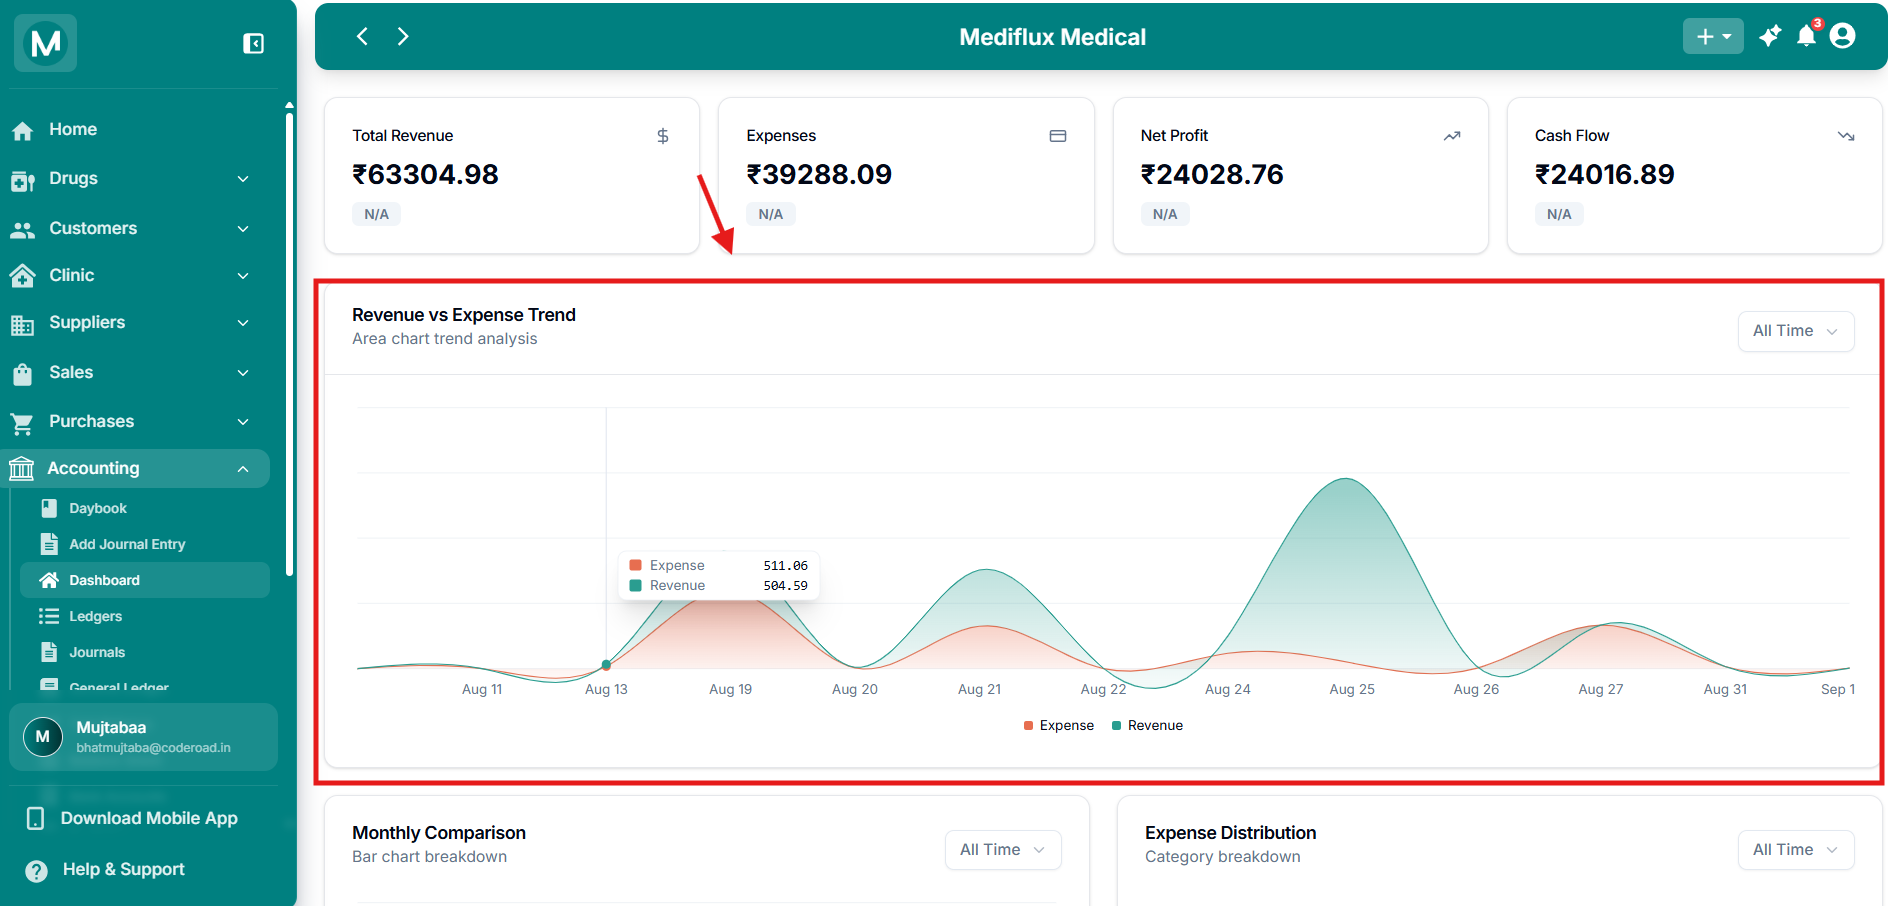
Revenue vs Expense Trend
Area chart comparing revenue and expenses over the selected period.
Monthly Comparison
The bar chart compares total revenue and total expenses for each month.
- Green bar = Revenue
- Red bar = Expenses
This view is useful for identifying cost spikes or months where profit was unusually high or low.
The same time filter (All Time, etc.) applies to this chart.
Expense Distribution
The pie chart breaks your total expenses into categories for the selected period.
Each slice shows the amount spent in that category. Hover over a slice to see the exact value and percentage.
This helps you quickly see which expense categories are consuming the largest share of your costs.
Financial Alerts
At the bottom of the dashboard, MediFlux surfaces important warnings when something needs attention.
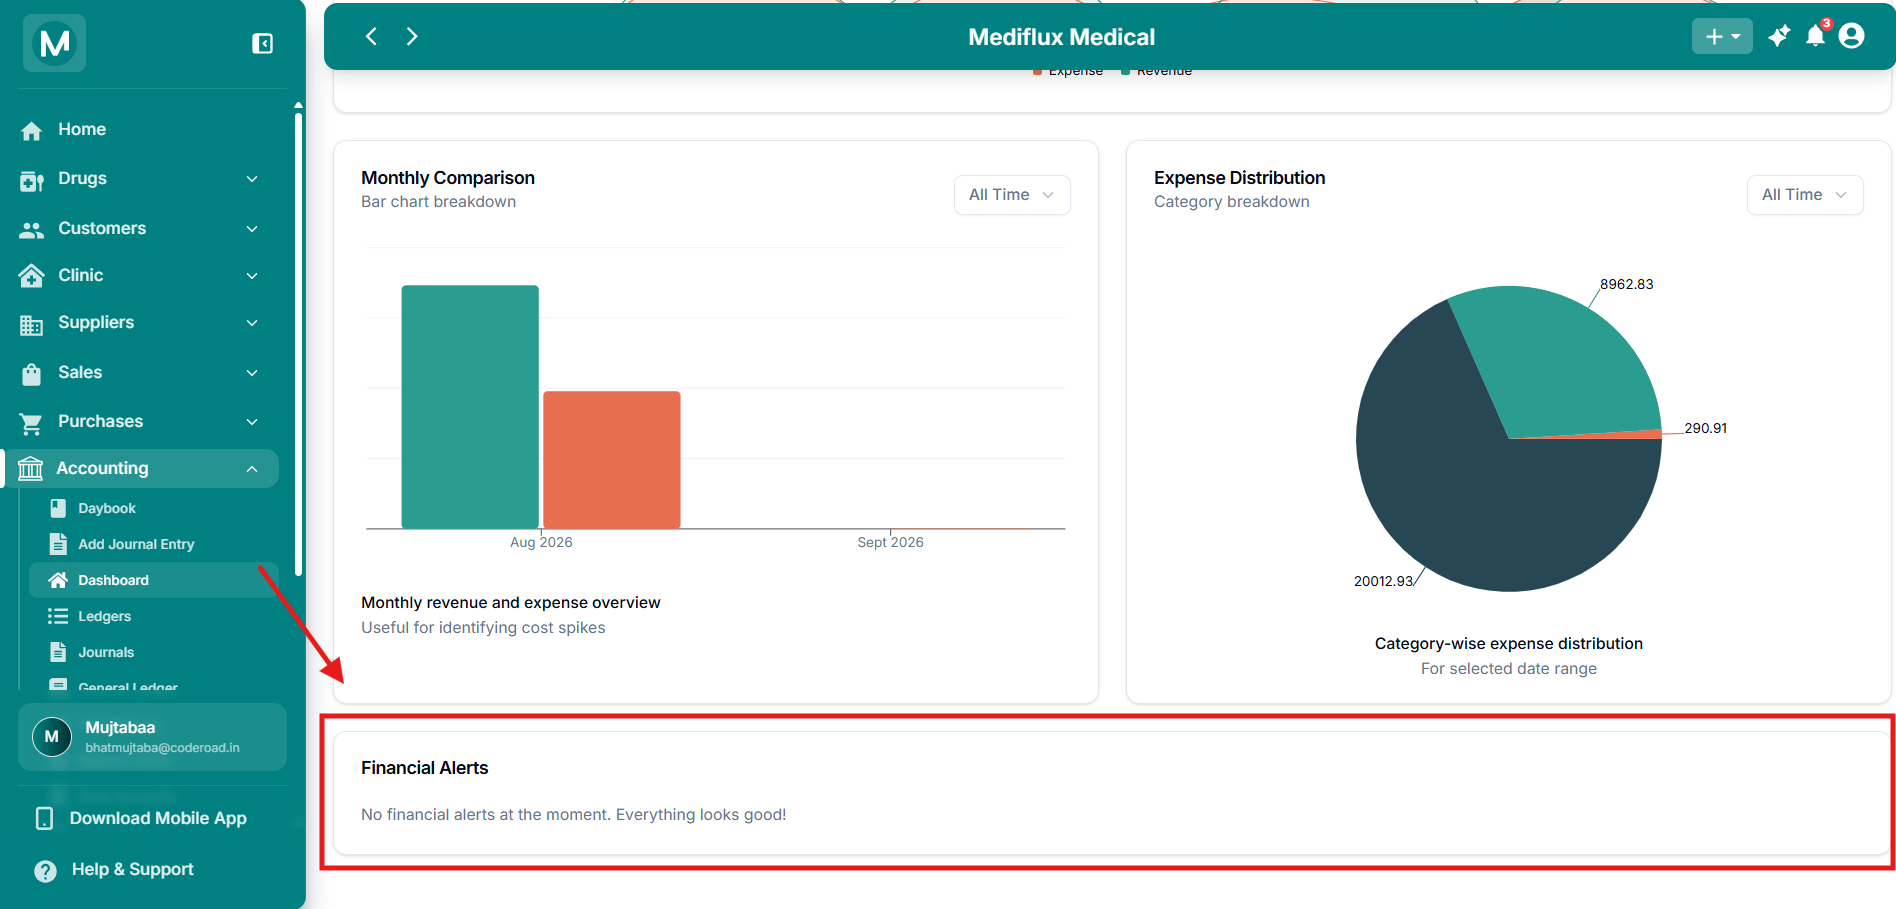
Dashboard on a new store
Zero values in all cards, empty charts, and a Low Liquidity alert.
Common mistakes
Expecting data on a brand-new store
Until you record sales, purchases, payments, or journal entries, every card will show ₹0.00 and the charts will be empty. This is normal.
Ignoring the Low Liquidity alert
If the dashboard shows Low Liquidity, your cash and bank balances are at or below zero. Check the Daybook and Cash & Bank accounts before making further payments.
Frequently asked questions
Next steps
Profit & Loss
See the full income and expense breakdown that feeds the dashboard numbers.
Daybook
View every transaction that contributed to revenue, expenses, and cash flow.
Journal Entries
Inspect the individual journals behind the dashboard figures.
Balance Sheet
Check your assets, liabilities, and equity position.