
Balance Sheet
Statement of financial position as on a selected date.
The Balance Sheet is a snapshot of your pharmacy's financial position at a single point in time. It answers one fundamental question: what does the business own, and how is it financed? The sheet is divided into three sections: Assets, Liabilities, and Equity. It is governed by the accounting equation:
Assets = Liabilities + Equity
In MediFlux, the Balance Sheet is generated automatically from your ledger balances. Unlike the Trial Balance, which lists every account with its activity, the Balance Sheet groups accounts into meaningful categories and shows only the net closing balance of each.
Navigate here from the sidebar: Accounting → Balance Sheet.
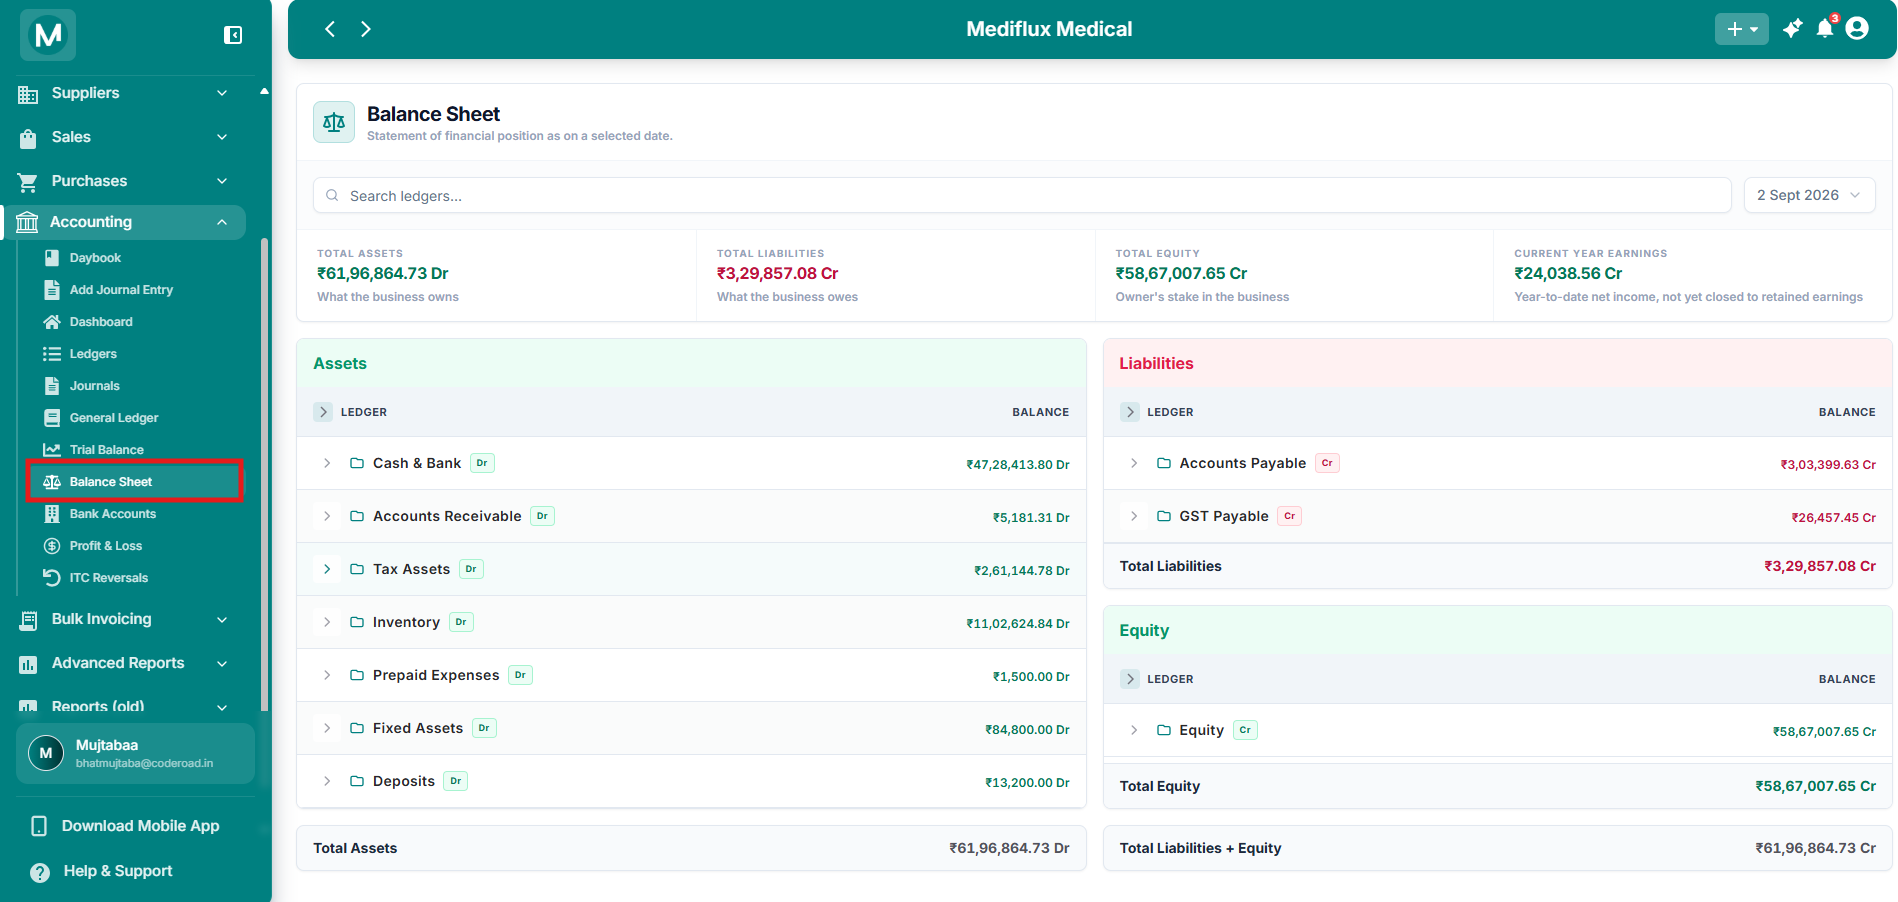
Balance Sheet overview
A snapshot of financial position on a selected date.
Seach and Filter by Date
The Balance Sheet is a snapshot, not a period report. Use the date picker at the top to select the as-on date. This defaults to today. Click the field to open the calendar and pick any past date to see what your financial position looked like then.
Use Search ledgers to find a specific account by name instantly.
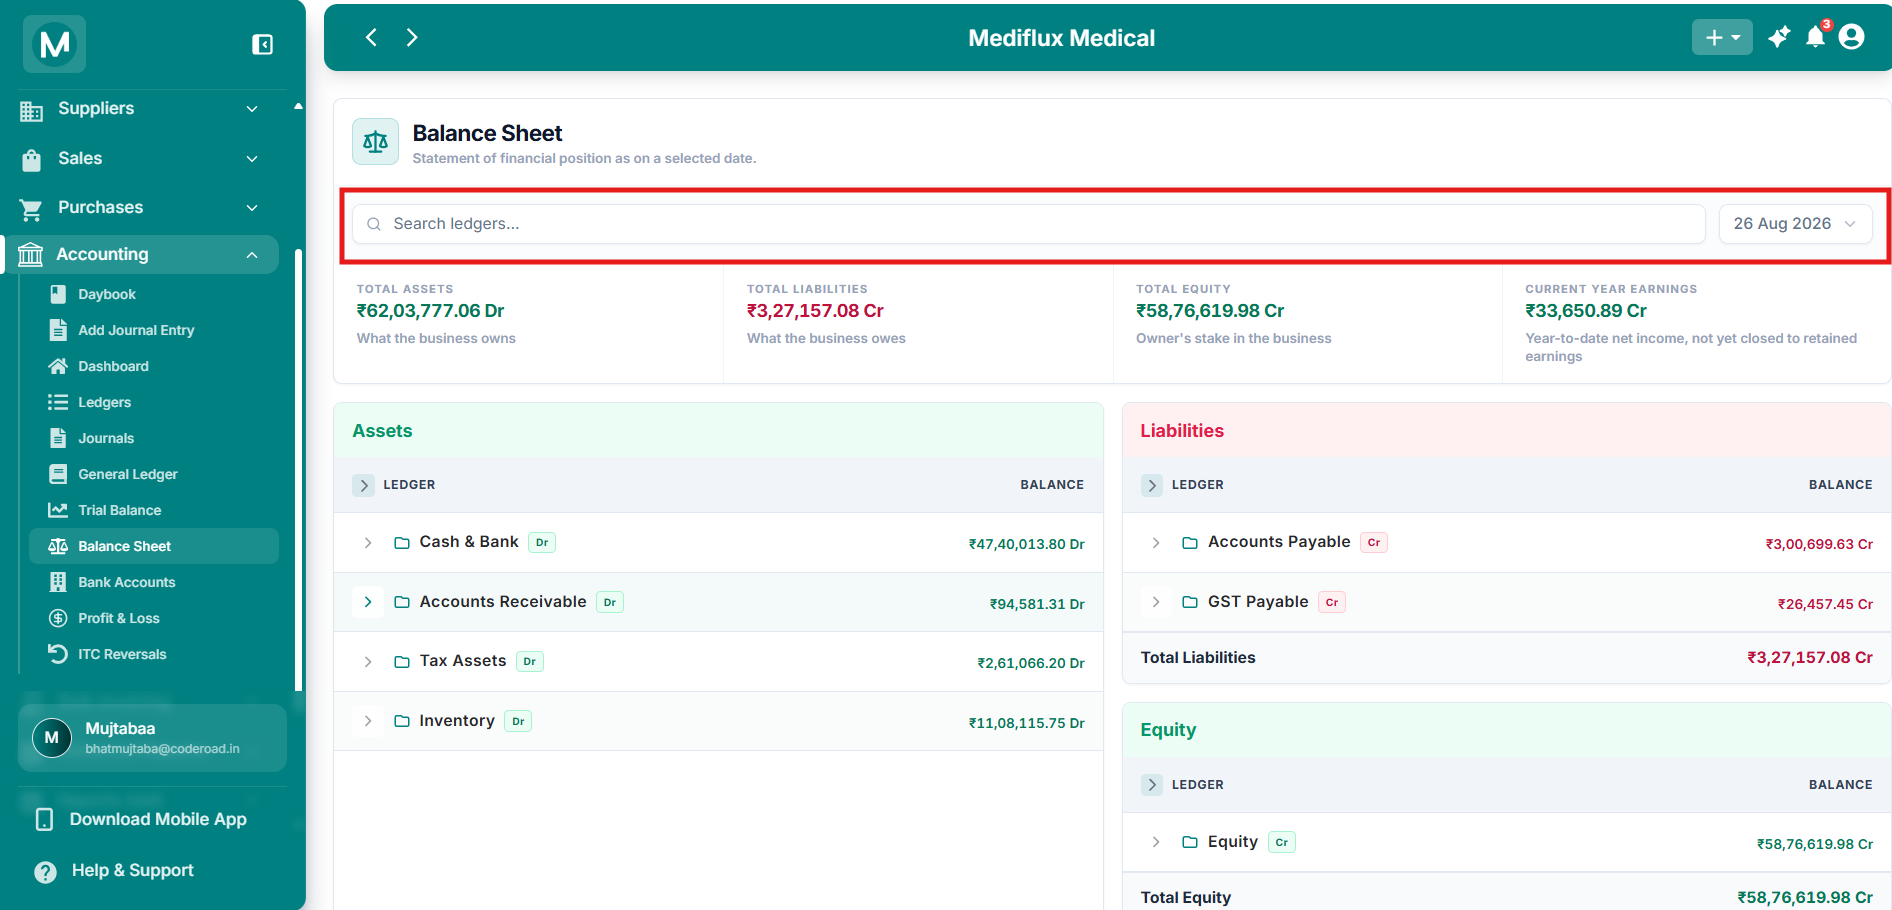
Search and Filter on Balance Sheet
Select any past date to view the financial position as on that day.
Summary cards
Four cards sit at the top, giving you the big picture at a glance:
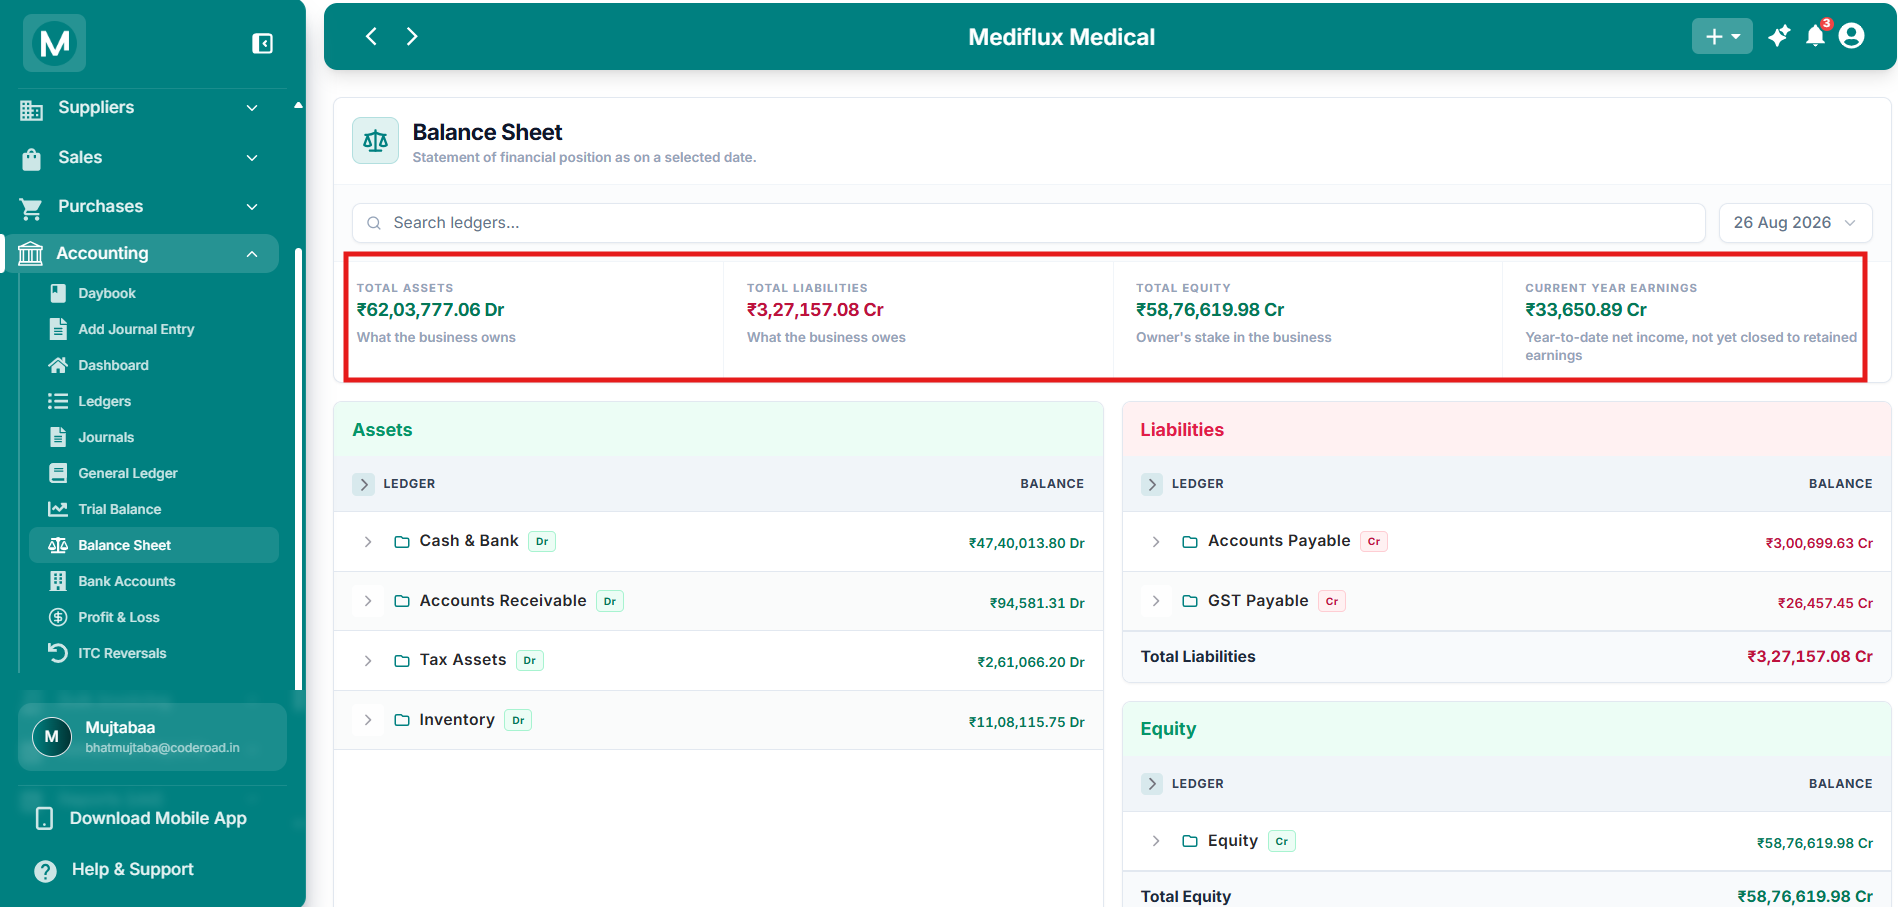
Summary cards
Total Assets, Total Liabilities, Total Equity, and Current Year Earnings.
Total Assets must always equal Total Liabilities + Total Equity. If these numbers do not match, there is a fundamental error in the books that must be resolved.
Assets
Assets are what your pharmacy owns. They are listed in order of liquidity, with the most liquid assets (cash, receivables) at the top and fixed assets at the bottom.
Click the arrow next to any parent group to expand it and see the individual child account balances.
Example: Newly initialized store
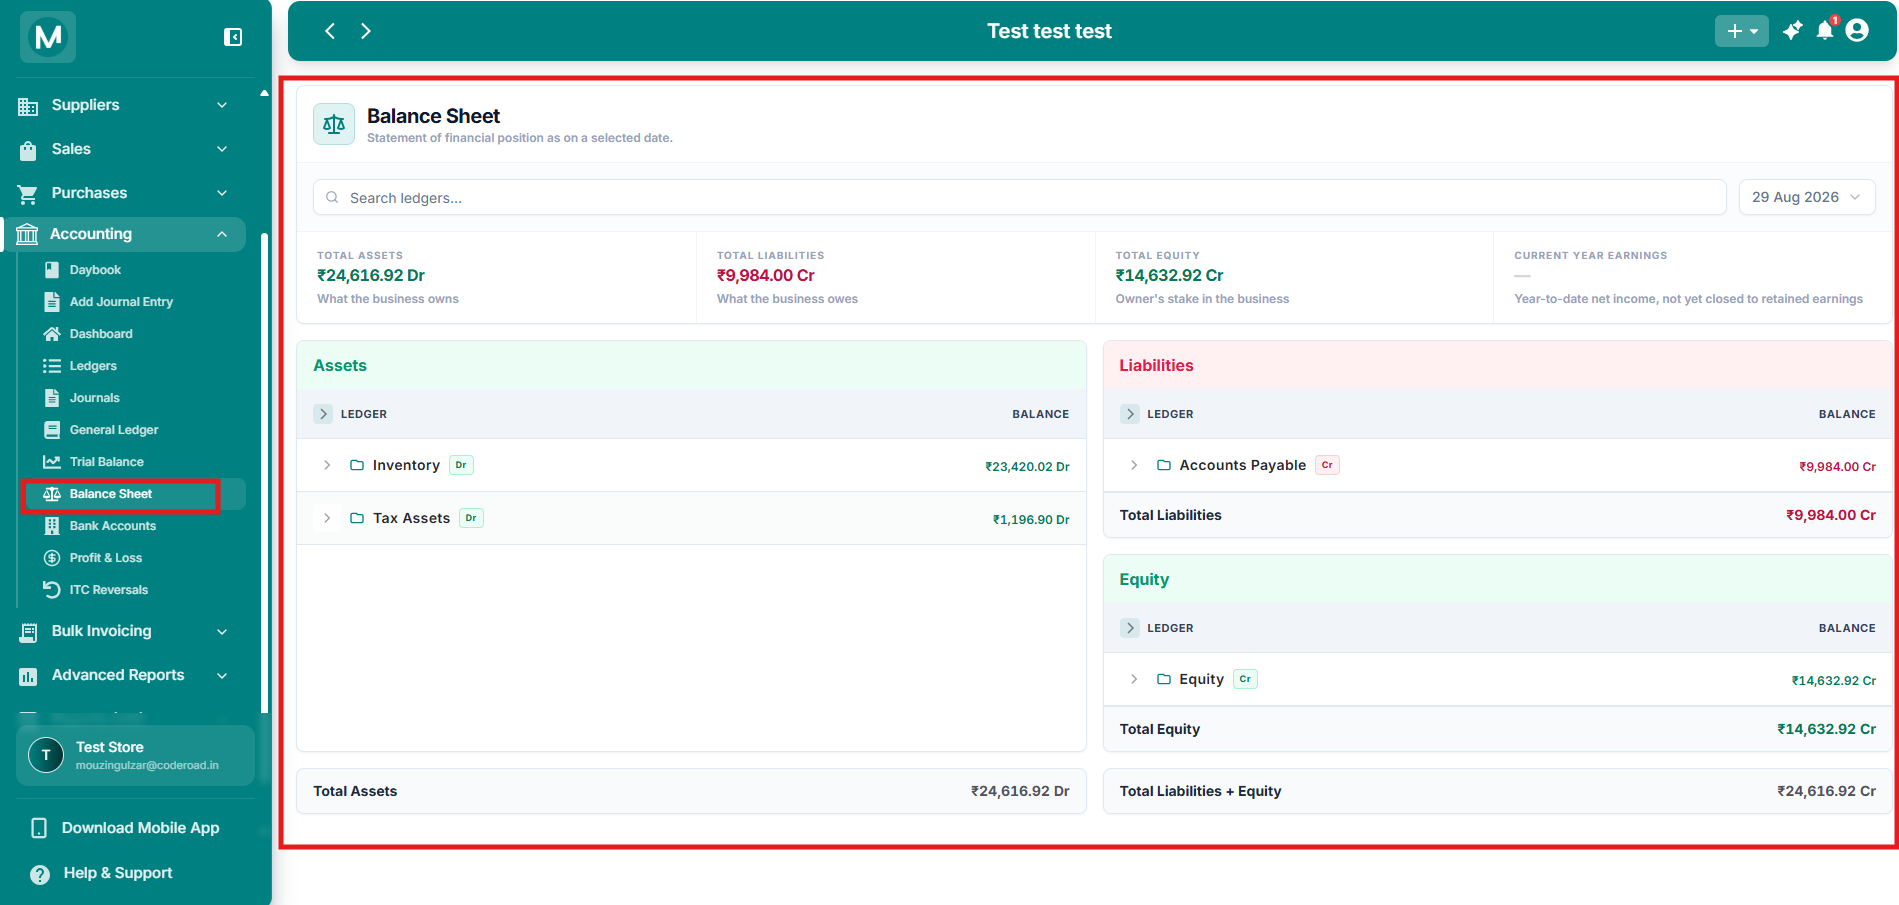
Balance Sheet on a new store
Minimal but balanced. Only inventory and tax assets appear.
In this example, the store has just been initialized. The only assets are inventory stock and input GST credits. There are no bank balances, receivables, or fixed assets yet.
Example: Mature store
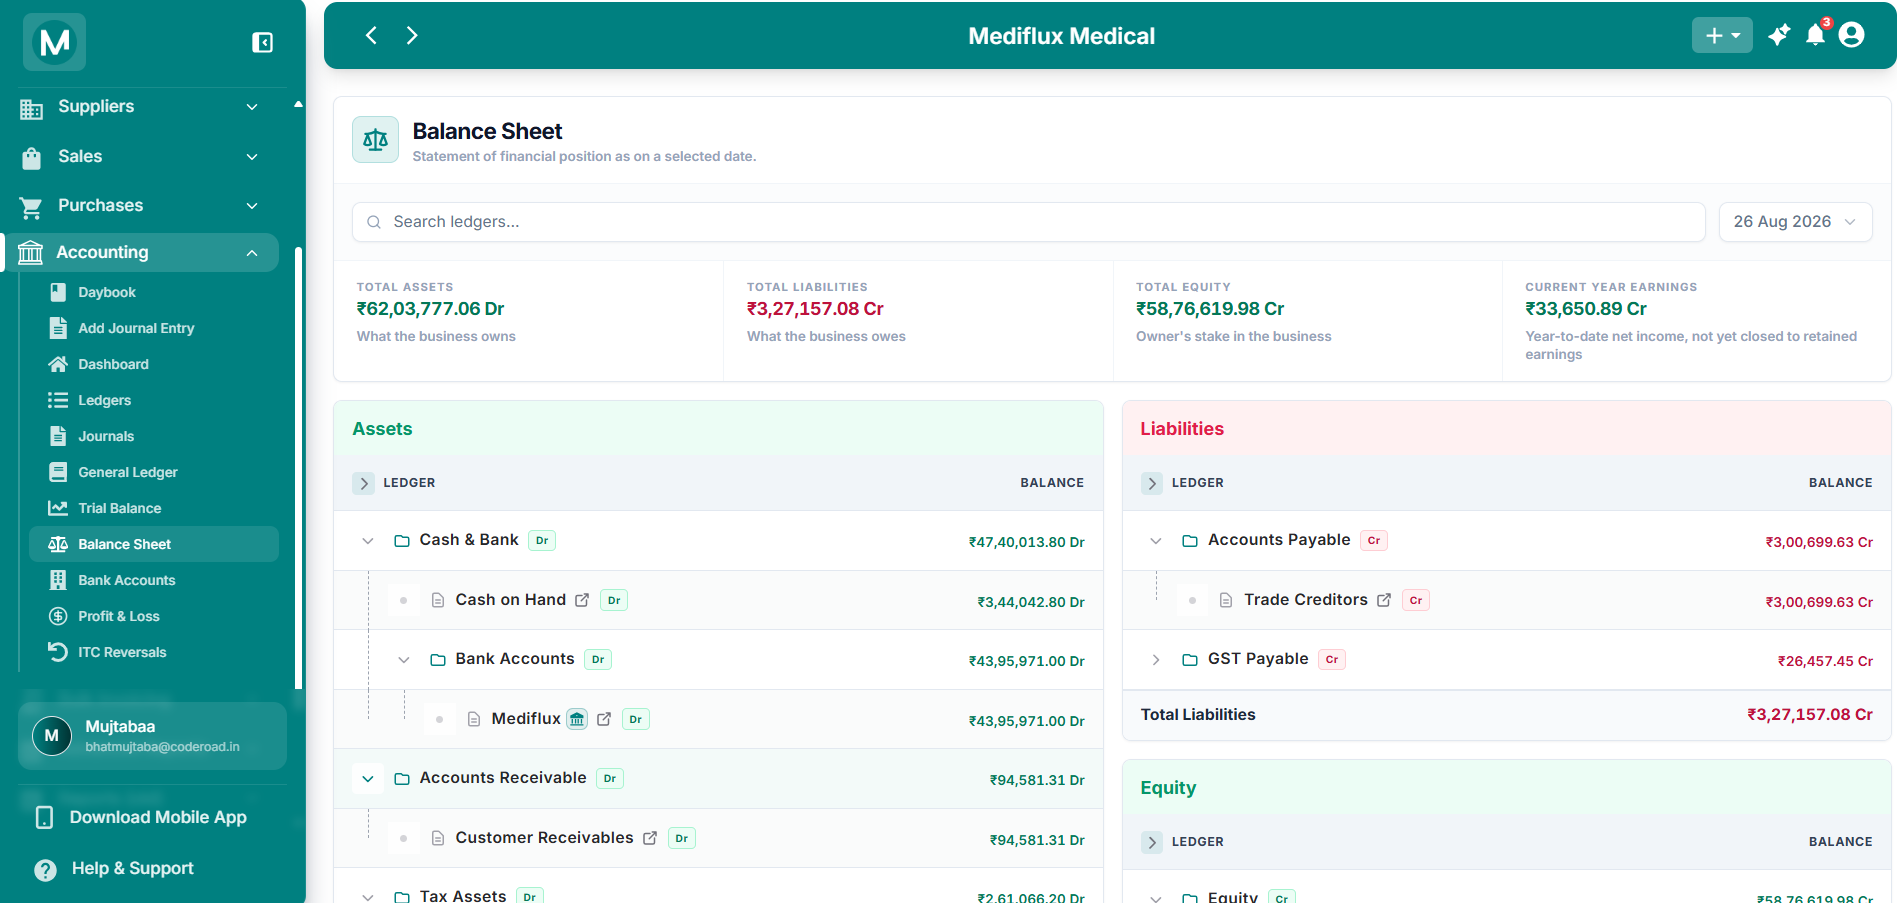
Assets section (mature store)
Cash & Bank, Receivables, Inventory, and Tax Assets fully expanded.
Purchase Return and Purchase Return - Non-Drug Inventory carry credit balances. These are contra-asset accounts that reduce the total value of inventory.
Liabilities
Liabilities are what your pharmacy owes to others. They are listed in order of due date, with current liabilities (due within a year) first.
Example: Newly initialized store
Example: Mature store
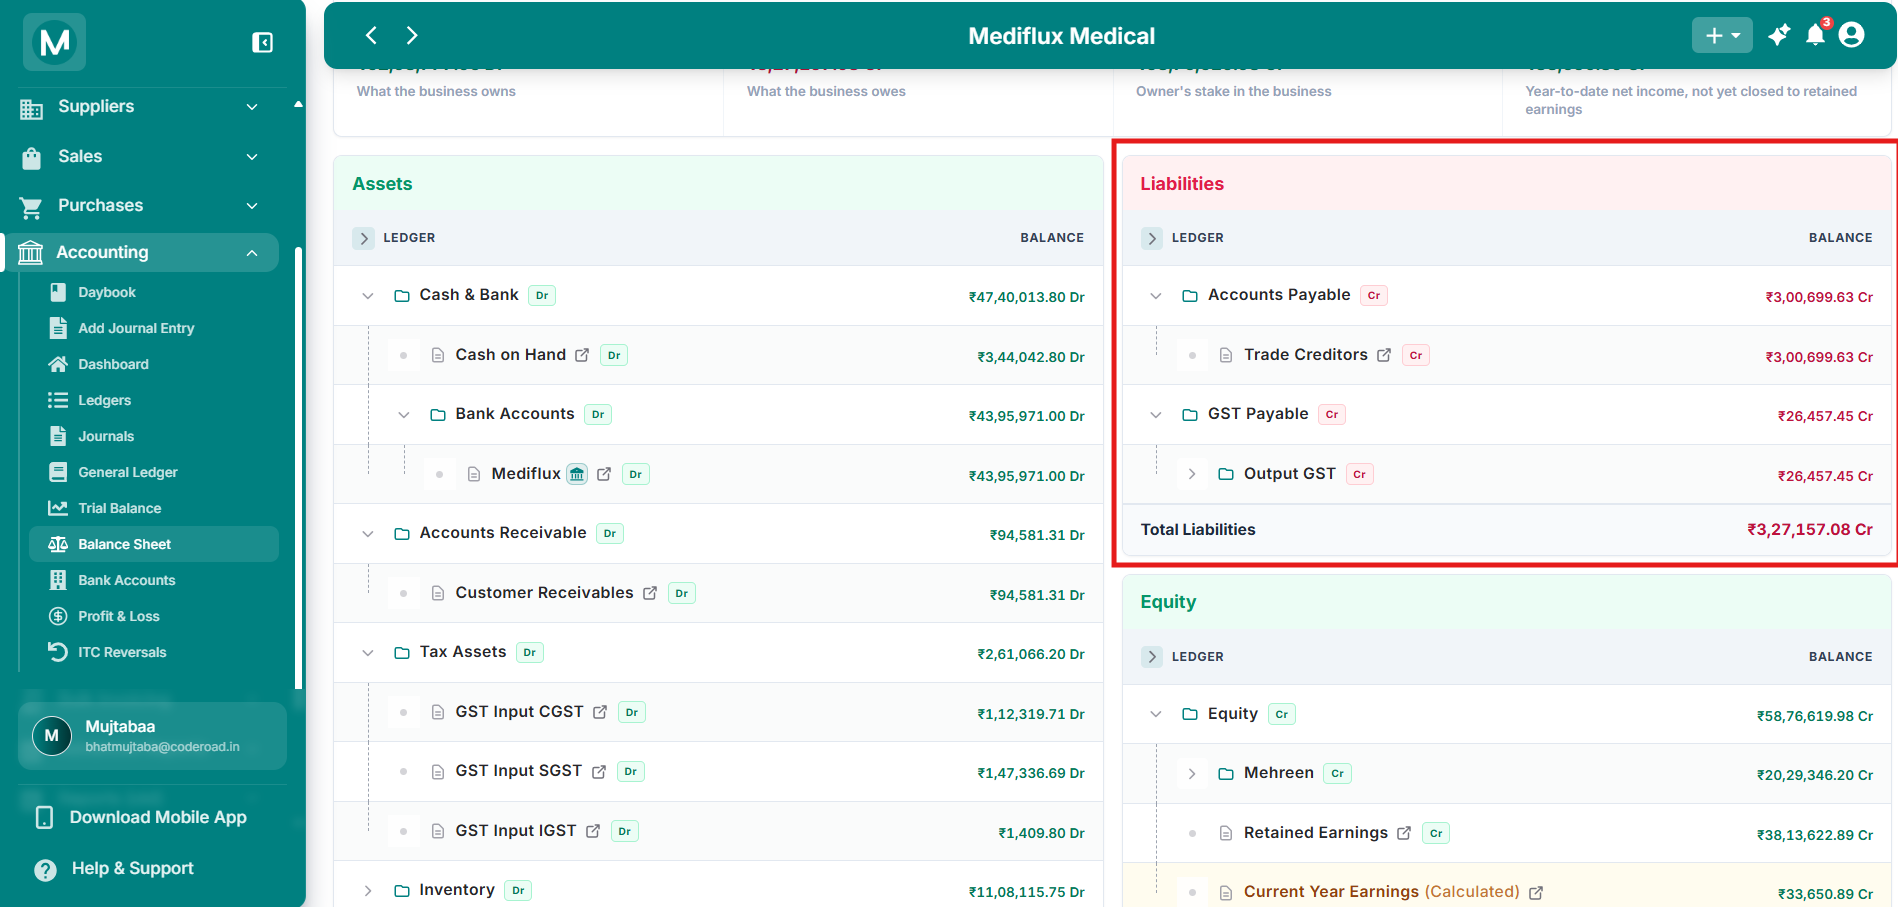
Liabilities section (mature store)
Accounts Payable and GST Payable with sub-accounts.
GST Payable is a liability because it represents tax collected from customers that must be remitted to the government.
Equity
Equity represents the owner's residual claim on the assets after all liabilities are settled. It includes capital invested, retained profits from previous years, and the current year's earnings.
Example: Newly initialized store
Example: Mature store
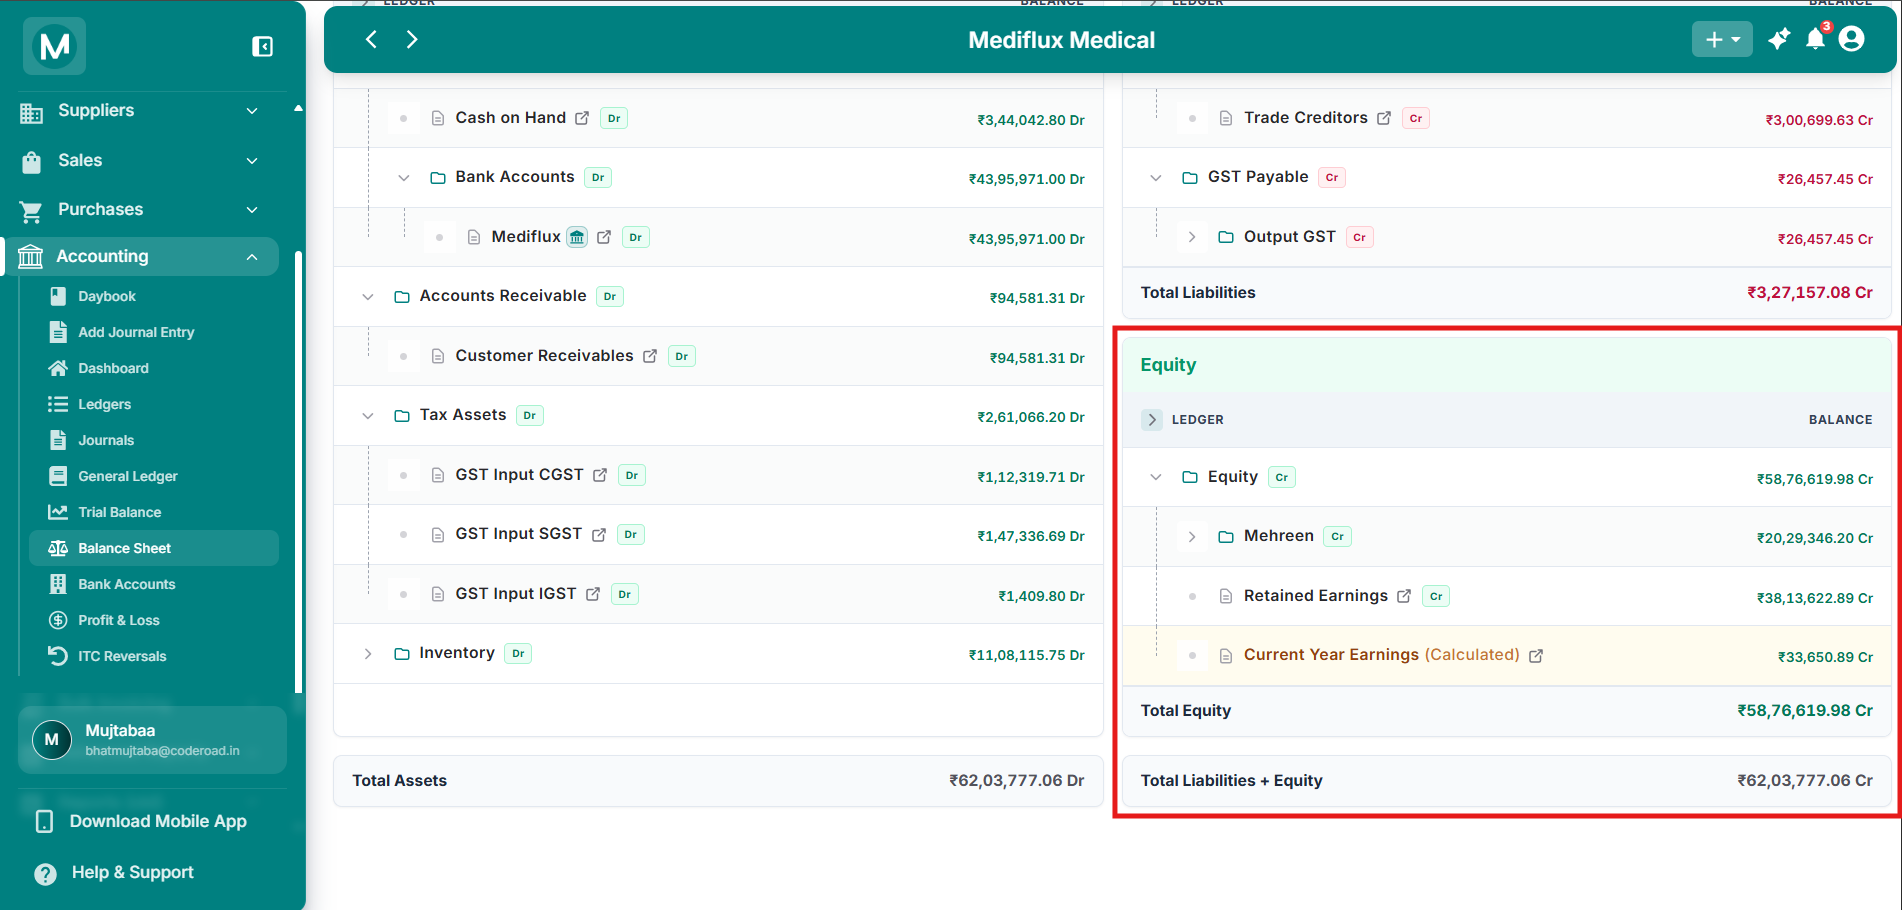
Equity section (mature store)
Retained Earnings, Current Year Earnings, and owner capital/drawings.
Current Year Earnings (Calculated) is kept separate from Retained Earnings so you can see how much the business has earned in the current period. Owner's Drawings is a contra-equity account that reduces total equity.
Why Assets must equal Liabilities + Equity
Every transaction affects at least two accounts in a way that keeps the accounting equation balanced.
Because every transaction maintains the balance, the totals at the bottom of the sheet must always match:
Total Assets = Total Liabilities + Total Equity
Current versus Non-Current
The Balance Sheet separates assets and liabilities into Current and Non-Current categories.
This split helps you assess the short-term financial health of the pharmacy.
Common mistakes
Thinking the Balance Sheet shows your profit
The Balance Sheet shows position, not performance. It tells you what you own and owe on a specific date, not how much you earned during the period. For revenue, expenses, and net profit, open the Profit and Loss Statement.
Ignoring contra accounts that reduce parent totals
Accounts like Purchase Return under Inventory and Owner's Drawings under Equity carry opposite balances and actively subtract from their parent group. Always expand parent groups to see the full breakdown.